
Estimate the total forest area of this county in year 2000 according to the forest area of 91 raster units of TM image of Heshun county in Shanxi province
Step 1: Prepare the raster data of the sampling zone, then enter the spatial sampling interface:
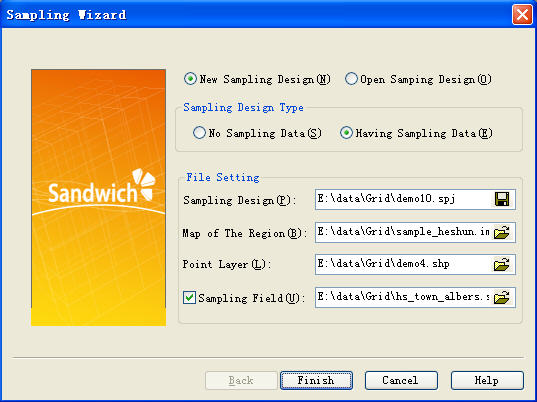
Figure 1.Select the sampling steps
Select: “ New Sampling Design-> Having sampling site data ”.
“ Sampling Design ” is the file that save the sampling design data , created and named by user, its postfix is.prj;
“Map of the region” is the RS image of the prepared sampling zone (it is .img format);
“Sample Site Layer” is the gained site data (it is the.shp file of ARCGIS).
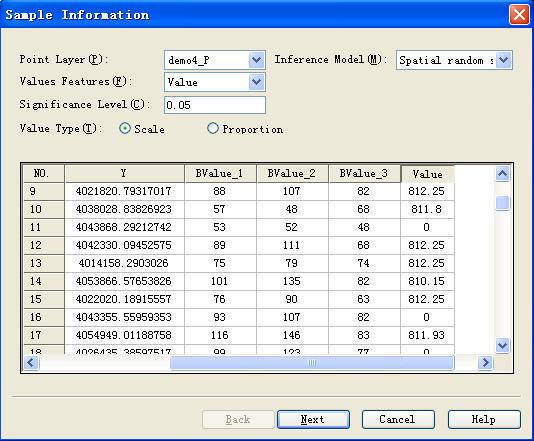
Step 2: Select the statistical features of the sample values
The selected sampling model is spatial random sampling, sample feature is “VALUE”, In Figure 2, Bvalue1 Bvalue2 Bvalue3 are the different waves of the image, the value is the grey level of this sample site in these waves, “Value” is the investigated forest area of the sample.
Step 3: View the statistical results
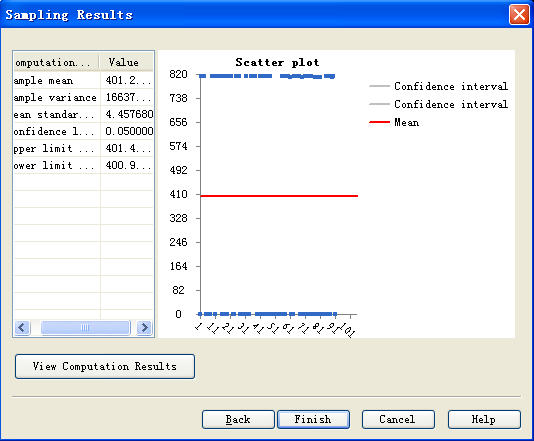
Figure3. View the scatter plot ( X-axis is the sampling unit size, Y- axis is the forest area of each sample unit)
The statistical results of sample features are on the left, the scatter plot of sample value is on the right.
(Because the sampling sites are generated randomly each time, and the change of each sample site is larger, the screenshots results and the calculation results may be not complete agreement)
Note: Before creating the new project file or importing the existed one, user need to close the opened project file.